Getting Started With Elasticsearch and Kibana (Opensearch)

What is the OpenSearch project?
The OpenSearch project, created by Amazon, is a forked search project based on old versions of Elasticsearch and Kibana. It is a 100% open-source search, analytics, and visualization suite.
Why use OpenSearch?
Fast, Scalable Full-text Search
Help users find the right information within your application, website, or data lake catalog.
Application and Infrastructure Monitoring
Easily store and analyze log data, and set automated alerts for underperformance.
Security and Event Information Management
Centralize logs to enable real-time security monitoring and forensic analysis.
Operational Health Tracking
Use observability logs, metrics, and traces to monitor your applications and business in real time.
About Elasticsearch
Elasticsearch is a distributed, RESTful search and analytics engine capable of addressing a growing number of use cases. As the heart of the Elastic Stack, it centrally stores your data for lightning fast search, fine‑tuned relevancy, and powerful analytics that scale with ease.
What can we do with Elasticsearch?
Numbers, text, geo, structured, unstructured. All data types are welcome. Full-text search just scratches the surface of how companies around the world are relying on Elasticsearch to solve a variety of challenges. See a full list of solutions built directly on the Elastic Stack.
- Log Monitoring
- Infrastructure Monitoring
- APM
- Synthetic Monitoring
- Enterprise Search
- Maps
- SIEM
- Endpoint Security
Install Elasticsearch with Docker
Pull the ElasticSearch Docker image by running the command:
docker pull docker.elastic.co/elasticsearch/elasticsearch:8.4.3
For local testing and development environment, we choose to start a single-node cluster.
The following commands start a single-node Elasticsearch cluster for development or testing.
Create a new docker network for Elasticsearch and Kibana
docker network create elasticStart Elasticsearch in Docker. A password is generated for the
elasticuser and output to the terminal, plus an enrollment token for enrolling Kibana.docker run --name es01 --net elastic -p 9200:9200 -p 9300:9300 -it docker.elastic.co/elasticsearch/elasticsearch:8.4.3Copy the generated password and enrollment token and save them in a secure location. These values are shown only when you start Elasticsearch for the first time.
Copy the
http_ca.crtsecurity certificate from your Docker container to your local machine.docker cp es01:/usr/share/elasticsearch/config/certs/http_ca.crt .Open a new terminal and verify that you can connect to your Elasticsearch cluster by making an authenticated call, using the
http_ca.crtfile that you copied from your Docker container. Enter the password for theelasticuser when prompted.
curl --cacert http_ca.crt -u elastic https://localhost:9200
The following response is showing the ElasticSerach Service is on.
{
  "name" : "f4cb13aa95c1",
  "cluster_name" : "docker-cluster",
  "cluster_uuid" : "g56s4nahTuGggUURU7jAUA",
  "version" : {
    "number" : "8.4.3",
    "build_flavor" : "default",
    "build_type" : "docker",
    "build_hash" : "42f05b9372a9a4a470db3b52817899b99a76ee73",
    "build_date" : "2022-10-04T07:17:24.662462378Z",
    "build_snapshot" : false,
    "lucene_version" : "9.3.0",
    "minimum_wire_compatibility_version" : "7.17.0",
    "minimum_index_compatibility_version" : "7.0.0"
  },
  "tagline" : "You Know, for Search"
}
About Kibana
Kibana is a free and open user interface that lets you visualize your Elasticsearch data and navigate the Elastic Stack. Do anything from tracking query load to understanding the way requests flow through your apps.
Kibana Features
Kibana gives you the freedom to select the way you give shape to your data. With its interactive visualizations, start with one question and see where it leads you.
- Basics: Kibana core ships with the classics: histograms, line graphs, pie charts, sunbursts, and more. And, of course, you can search across all of your documents.
- Location analysis: leverage Elastic Maps to explore location data, or get creative and visualize custom layers and vector shapes.
- Time series: Perform advanced time series analysis on your Elasticsearch data with our curated time series UIs. Describe queries, transformations, and visualizations with powerful, easy-to-learn expressions.
- Machine learning: Detect the anomalies hiding in your Elasticsearch data and explore the properties that significantly influence them with unsupervised machine learning features.
- Graphs and networks: take the relevance capabilities of a search engine, combine them with graph exploration, and uncover the uncommonly common relationships in your Elasticsearch data.
Install Kibana with Docker
With created Elasticsearch container for development or testing, we can easily install Kibana with Docker.
In a new terminal session, start Kibana and connect it to your Elasticsearch container:
docker pull docker.elastic.co/kibana/kibana:8.4.3
docker run --name kib-01 --net elastic -p 5601:5601 docker.elastic.co/kibana/kibana:8.4.3
When you start Kibana, a unique link is output to your terminal.
To access Kibana, click the generated link in your terminal.
In your browser, paste the enrollment token that you copied when starting Elasticsearch and click the button to connect your Kibana instance with Elasticsearch.
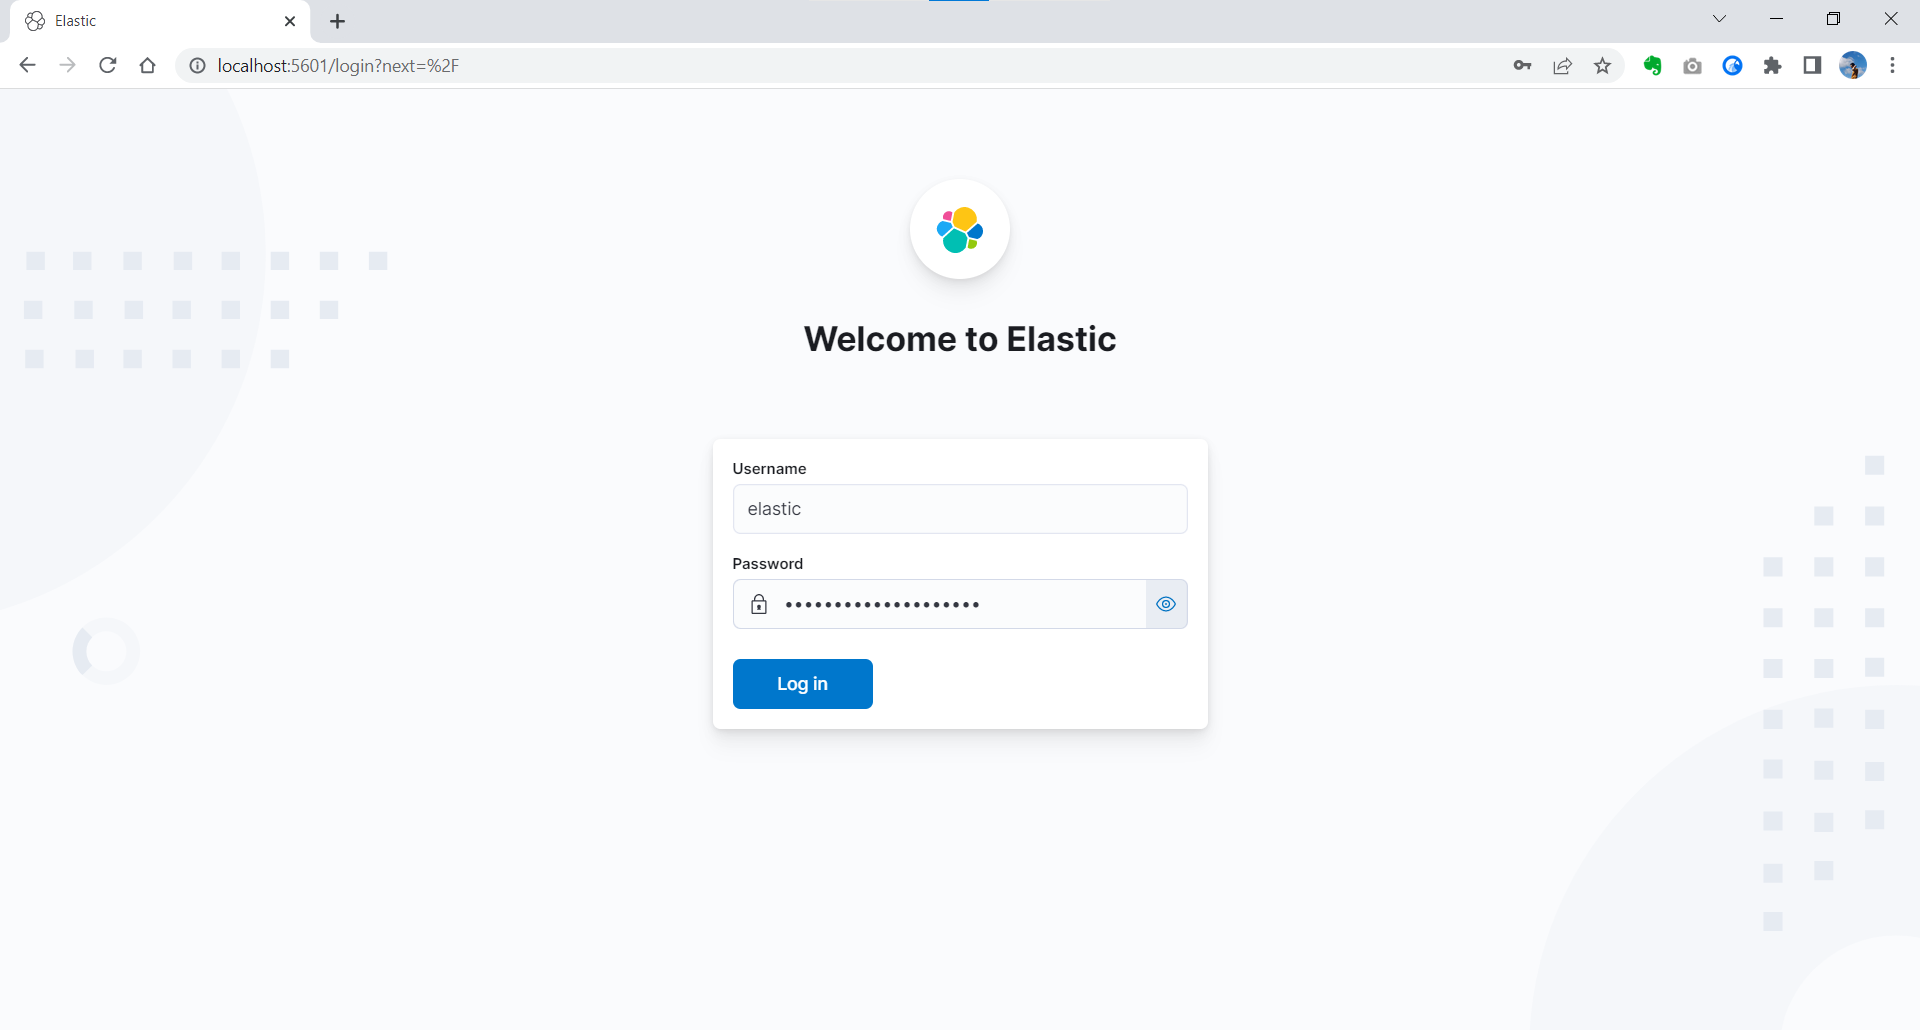
Log in to Kibana as the
elasticuser with the password that was generated when you started Elasticsearch.
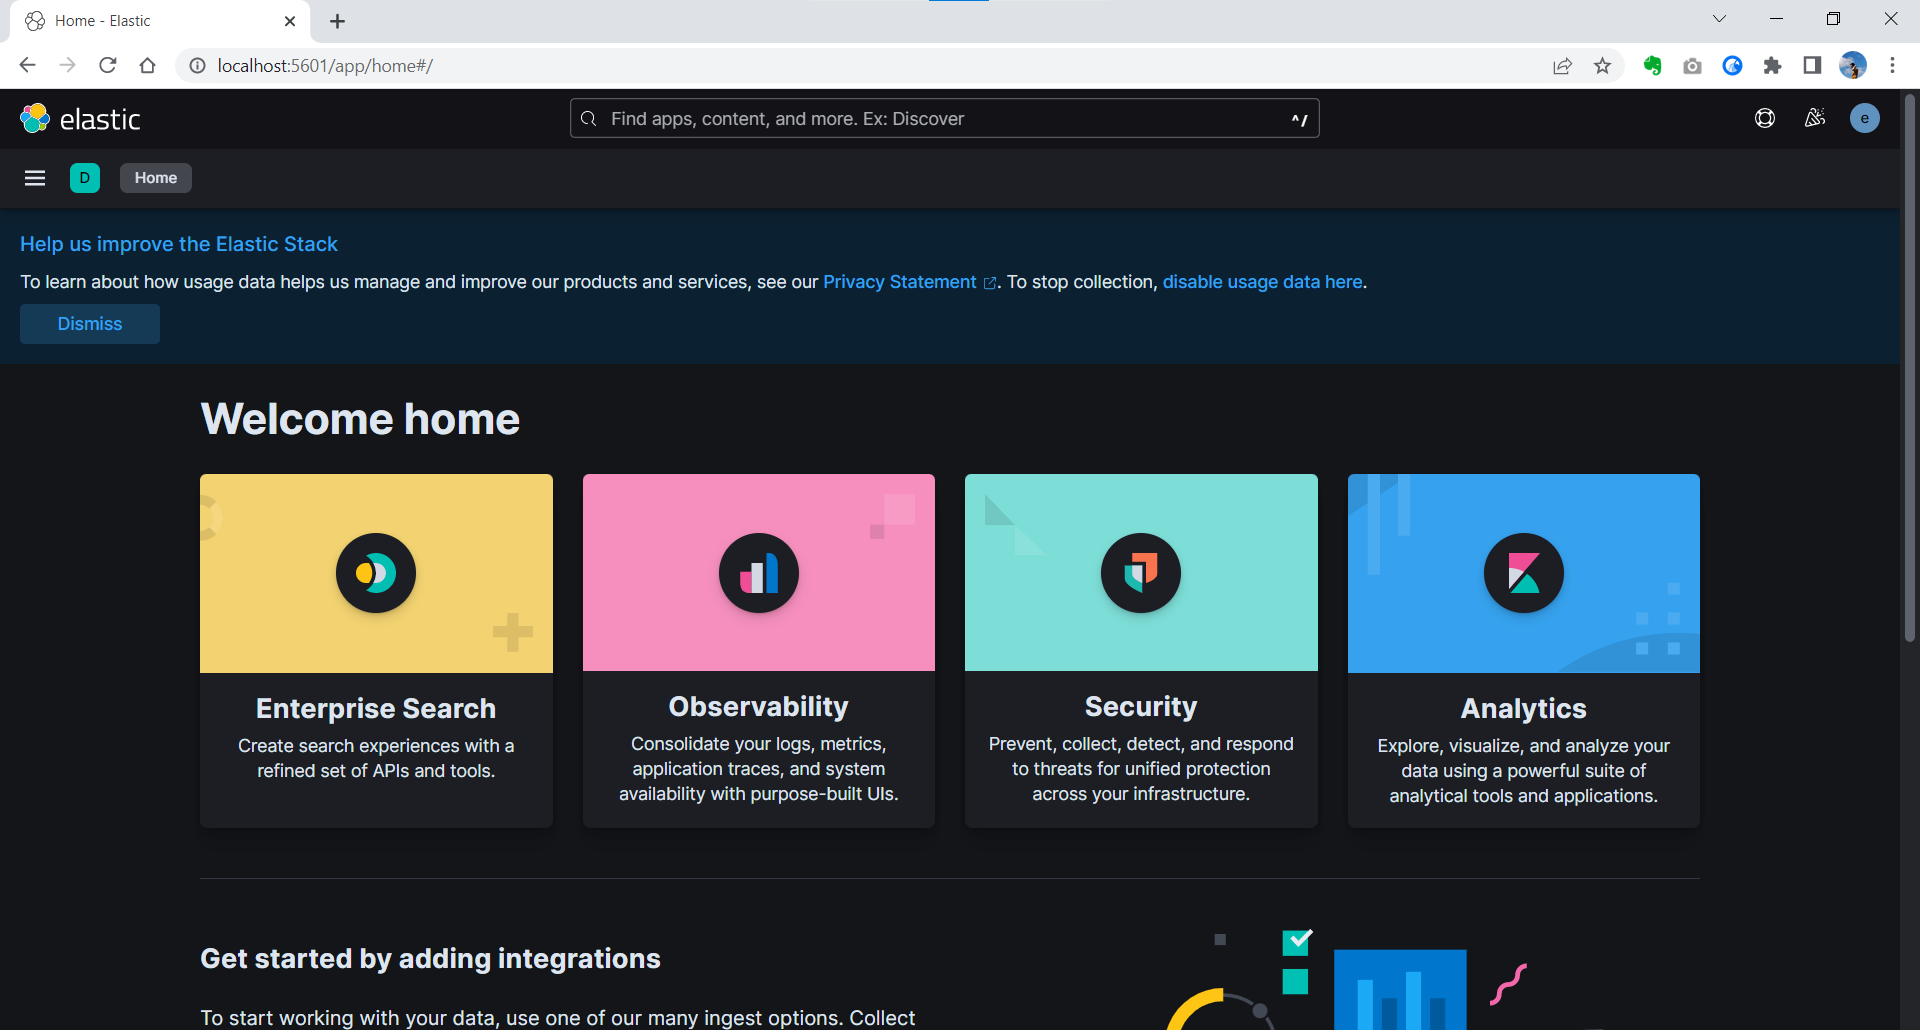
The home page of Kibana is showing and ready to explore.

 William Yu
